

Venn diagram is not just that simple but ingenious tool that helps you to solve those complicated set problems. Venn diagram is a powerful tool.
A Venn diagram or set diagram is a diagram that shows all possible logical relations between a finite collection of sets. Venn diagrams were conceived around 1880 by John Venn. They are used to teach elementary set theory, as well as illustrate simple set relationships in probability, logic, statistics, linguistics and computer science.
A Venn diagram can represent something simple like the intersection between 2 sets:

or something complicated like the intersection and union of 16 different sets:

But how can they help us to solve problems? I will try to show you by examples when to use a Venn diagram.
Example 1:
One of the hardest problem that emergency units have in hospitals is how to prioritize the resources in the most effective way possible.
After an explosion in a chemical factory came 77 people to the emergency room (ER) to seek for help. 49 people had respiratory failure and 38 people complained of headaches. The ER stuff decided that:
- those patients that have headaches they don't need special attention, they can take an aspirin and then go home
- those patients that had respiratory failure should be treated with normal priority by the ER stuff
- only those patients that had both headaches and respiratory failure should be treated with high priority (they need special assistance)
The question is: how many of all these patients need special assistance, i.e. must be treated with high priority by the ER stuff?
To solve this problem only with the algebraic means would be cumbersome. It's not always simple to model such a problem algebraically, i.e. we don't see immediately what are the variables and how to create some set of equations with them which later it's reduced to solve a trivial system of equations. Here comes in help Venn diagrams, these discrete tools of mathematics created specially when dealing with sets (like set of peoples, set of problems, etc).
Let's call the set of all these patients U. We note by  the number of elements within U. In our example
  .
.
Let's call the set of those patients with respiratory failure R, where  .
.
Let's call the set of those patients with only headaches problems H, where  .
.
Those patients that had both respiratory failure and headaches problems belongs to both sets, R and H. In fact they belongs to the  and this subset is what we are looking for, i.e. those that should be treated with high priority.

If we take a look at the Venn diagram above we can clearly see that if we add those elements of R with those elements of H we add in fact those elements that only appears in R with those elements that only appears in H and twice those elements that are shared between R and H. With other words:
 (R1)
(R1)
Moreover, we can see that if we add only those elements in R with only those elements in H and with those elements shared in common by R and H we get the union between R and H:
 (R2)
(R2)From (R1) and (R2) above we can conclude that:
 (R3)
(R3)
These three relations are extremely important when working with sets. I know that the union between R and H have 77 elements in total. I know that only R has 49 elements while only H has 38 elements. I can use (R2) and extract 
So the answer is: 10 patients needed special assistance (they had to be helped with high priority).
Example 2:
In a language institute do study 65 students the English language, 45 students the German language and 42 students the French language. They don't study any other language. Moreover we know that:
- 20 students do study both the English and German languages
- 25 students do study both the English and French languages
- 15 students do study both the French and German languages
- 8 students do study all three languages (i.e the English, the German and the French)
The question is : how many students do study in total at that language institute?
If the previous problem seemed a bit easier to be described in terms of some unknown variables such that we could create an algebraic system of equations and then solve the problem by algebraic means, this one seems just a bit difficult than that, isn't it?
Here I would only use set theory with its Venn diagram than Algebra because this way the problem is just a piece of cake. Let me show you!
Let's call G that set of students which do study German, F that set of students which do study French and E that set of students which do study English language.
We know that  . We also know that:
 ,
,  ,
,  and
and  .
.
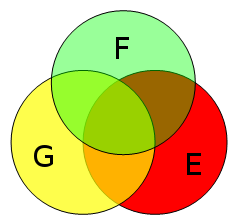
We can see that the total number of elements (which is our dilemma)Â is equal to the number of students that do study only English + number of student that do study only German + number of student that do study only French + number of students that study both English+German (but not French) + number of students that study both English+French (but not German) + number of students that study both French+German (but not English) - 2 times the number of students that study all three languages:
 (R4)
(R4)
 the answer is quite simple. By adding
  we have included three times that small intersection. Because we wanted to add only once that we have to subtract twice those additional copies.
 If we use the (R4) and also (R1) then we can understand that:
 such that we can solve our problem by just plugging those number in this equation but I just wanted to show you that by using the Venn diagram you can really visualize the problem and find the solution quite easily. So in the following we'll stick to our original solution and not choosing the shortcut mentioned above.
If we find out the value for  we have solved our problem.
So, what is  for instance?

Likewise 
and 
We plug all these data into (R4) and get 
There are 100 student that do study in that language institute.
Conclusion: by using Venn diagram we can easily solve problems involving sets, although they might seem tricky and complicated at first sight.
Now, if you think that this article was interesting don't forget to rate it. It shows me that you care and thus I will continue write about these things.
Eugen Mihailescu
Latest posts by Eugen Mihailescu (see all)
- Dual monitor setup in Xfce - January 9, 2019
- Gentoo AMD Ryzen stabilizator - April 29, 2018
- Symfony Compile Error Failed opening required Proxies - January 22, 2018